This month, when I have not been in the field, I have been working on data (information) about pests at Paraninihi. The pests are caught in traps. When the traps are checked a note is made like this:

This information is then put in a spreadsheet like this:

I have been helping to put the spreadsheet information in a Pest Mapper like this:

Then I can make graphs to see what is happening to the pests over time:

February 23rd
It is sea week in the first week of March. We have been preparing for the Coastblitz on Thursday the 4th (5pm at Kamaroa). This is when people will be shown how to look at all the living things between the low and high tide zones. There will be experts to help identify them. We have been making a sheet so that people can write down what they see. You can take pictures of your finds and load them on the Nature Watch website.
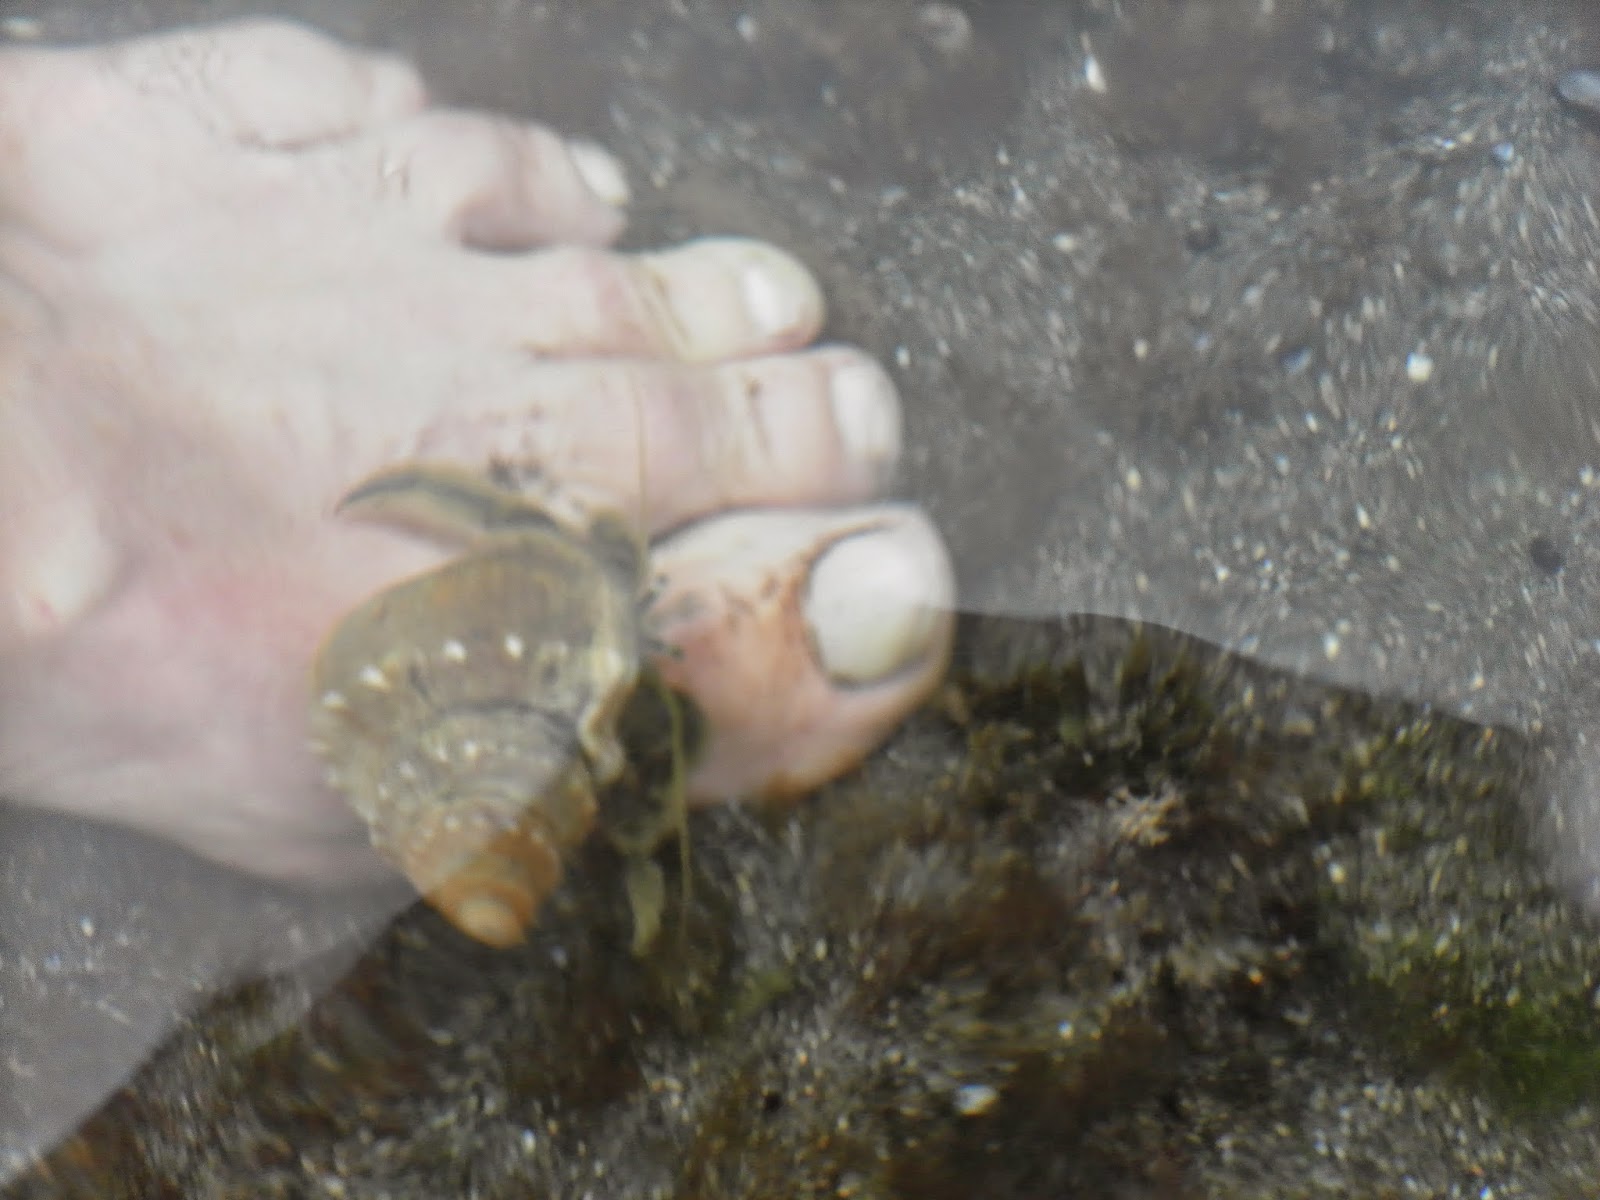
As part of the Experiencing Marine Reserves (EMR) programme, Huirangi school are going to the Tapuae Marine Reserve (near Back Beach) to practise surveying the intertidal zone (the area between low and high tide). I went down a few days before to help sort out the best way to do this. We use a quadrat which is a grid to help us sample an area carefully:


No comments:
Post a Comment